Repeatability and Reliability Evaluation of a Wireless Head-band Sensor
Article information

Abstract
OBJECTIVES
The objective of this study to examine the reliability and repeatability of the headband sensor in comparison with the gold standard 3 linear and 3 angular rate sensors placed at the center of gravity of the Hybrid III dummy head during drop tests.
METHODS
A SIM-G headband sensor was attached to a Hybrid III dummy head and neck which was equipped with a triaxial accelerometer and 3 angular rate sensors. Linear acceleration and angular rate was sampled at 10,000 Hz while the SIM-G headband was sampled at 1000 Hz and 800 Hz respectively. A drop test was developed to test between 20 to 140 g and consisted of a total of 400 impacts in four locations, left occipital, right occipital, frontal and rear impacts with 100 impacts per location. Multiple tests were performed at the same height to verify the reliability of the devices. SIM-G data and the reference sensors were compared for validity.
RESULTS
The reliability measured by Cronbach's alpha showed very high repeatability for the SIM-G (α = 0.97-0.99). However, the validity measurement, Pearson's Correlation coefficient (r), showed a weak to very strong relationship (r=0.2-0.9).
CONCLUSIONS
While using the SIM-G sensor to help monitor head impact, the weak to strong validity of the SIM-G sensor must be carefully considered by the clinicians or researchers as a serious limitation.
Introduction
Research investigating head injury mechanics during practice and competition are underway in sports, such as ice hockey1, American football [2,3], soccer [4], boxing [5], and taekwondo[6]. With the different head protective requirements of each of these sports various head impact monitors for helmets and non-helmeted sports have been developed [7,8]. The Head Impact Telemetry (HIT) system (Simbex; Lebenon, USA) developed in 2003, which incorporates a nine-accelerometer array has been mainly in American gridiron football [2,3,8] and ice-hockey [1], but also been modified for use in soccer [4] and boxing [9]. Another head impact measuring device designed for use in helmeted sports the GForceTracker (GFT, Ontario, Canada) can be attached to different helmets [10]. The GFT samples linear accelerations at 3000 Hz and angular velocity at 800 Hz [10].
As not all impact sports have helmets or protective headgear, instrumented mouthpieces [11] have been developed for the dual use of orofacial protection and head impact data collection [12]. There are 3 known groups that have developed instrumented mouthguards; X2 Impact Mouthguard (Biosystems Inc., Seattle, USA), Intelligent Mouthguard (IMG, Cleveland Clinic, USA) developed by the Cleveland Clinic, and another mouthguard (not commercially available) developed by a group at Stanford University lead by Wu and Camarillo [13,14]. Similarly, skin patches (X2 X-Patch, Biosystems Inc., USA), and instrumented skullcaps and headbands, Checklight (Reebok; Canton, USA), Shockbox HD (Impakt Protective Inc., Kanak, Canada), SIM-G (Triax, USA) have also been developed.
To date, there is a dearth of peer review articles published testing the reliability and validity of the SIM-G. Karton and associates [15,16] impacted an instrumented Hodgson-WSU head-form and SIM-G with a pendulum impacting system. One limitation of this report is that even though the SIM-G records from a range of 3 to 150 g, they tested only between the ranges from 30 to 80 g linear accelerations. Another report [17] testing the SIM-G used an impulse hammer to impact an American football helmet worn by a Hybrid III ATD. Peak linear acceleration from the SIM-G was compared to the head-form data and root mean square errors of 17.91 – 74.68% and mean absolute value of errors of 10.3 - 50.36% were reported for the seven impact locations. Raw data was not recorded or published in this dissertation [17] and so other variables testing reliability and validity of the SIM-G are still needed. Therefore, the purpose of this research was to examine the reliability and repeatability of the headband sensor compared to 3 linear and 3 angular rate sensors at the center of gravity of the Hybrid III dummy head during drop tests.
Methods
Measurement Device
This study tested the accuracy and repeatability of the SIM-G headband sensor (Triax Technologies, USA)(Figure 1). The device is a six degree of freedom measurement device consisting of a high-g 3-axis accelerometer (up to 1000g), low-g 3-axis accelerometer (up to 100g) and a 3-axis gyroscope [15]. The linear accelerometers (3-150 g) were sampled at a rate of 1000 Hz and the angular acceleration was sampled at a frequency of 800 Hz [15]. Each impact about the 16 g threshold (manufacture selected) is then recorded for 10ms before the impact with 52 ms after the impact [15].
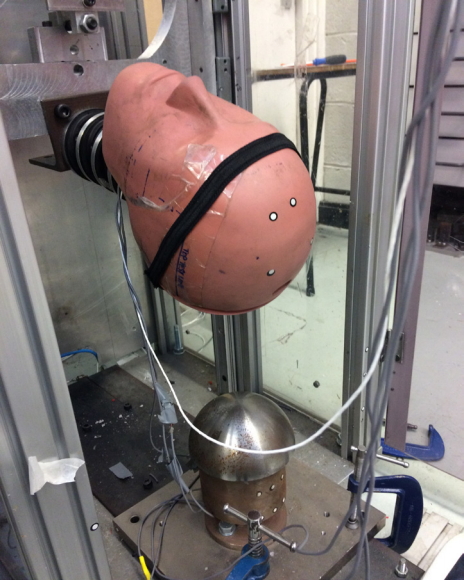
Hybrid 3 Dummy Head with Sim-G sensor (standard triaxial linear accelerometers and gyroscopes are placed at the head’s center of gravity and sim-g as placed on the back). The position of the sensors did not change during the drop testing and a total of 100 impacts were performed for each impact location.
Data Processing
Reference devices consisting of a triaxial linear accelerometer (Kistler 8688A) and three angular rate sensors (DTS ARS12K) were mounted in the centre of gravity of the head form on a manufacturer provided block (Humanetics Inc. USA). The reference data was sampled at 10,000 Hz providing 200 ms of data per impact. Linear acceleration was filtered at 1000 Hz and rotational velocity was filtered at 300 Hz which was verified as a suitable filter using Fourier transformation to calculate the amplitude spectrum, a finite difference method was computed in Matlab to provide rotational acceleration data. All reference data was recorded using customized Labview 2015 program (Texas Instruments, USA).
Testing Procedure
The testing procedure consisted of a total of 400 impacts in four locations, left occipital, right occipital, frontal and rear impacts with 100 impacts per location. The test conditions were designed to simulate the sensors full linear acceleration impact range of 20 g to 140g. To create these conditions the head form was fixed in a drop test rig and released from heights ranging from 0.09 m to 0.61 m, impacting a steel hemisphere of 0.12 m diameter. Ten tests were completed at each height to investigate the repeatability of the devices. Impacts at each height were recorded by the Sim-g and the reference sensors.
Statistical Analysis
All the impact data was analyzed using SPSS (version 23.0), and the Pearson’s Correlation Coefficient (Table 1), and Cronbach’s alpha (Table 2) were calculated.
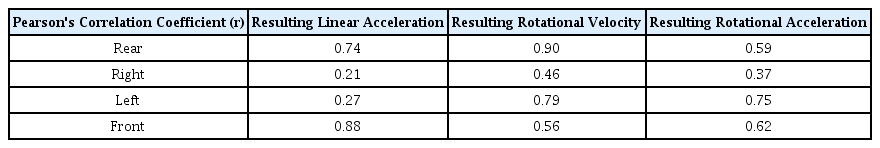
Pearson’s Correlation Coefficients for the comparison of the SIM-G and Triaxial Accelerometer
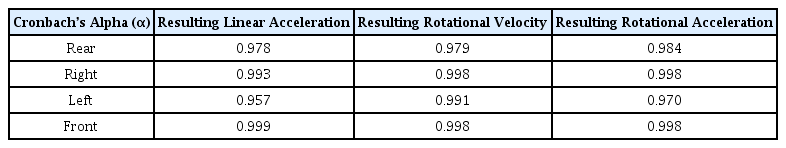
Cronbach’s alpha (α) for the reliability of the SIM-G for the 10 drop heights
Results
The validity between the 2 devices was shown by calculating the Pearson’s Correlation Coeffcient for the data between the SIM-G and the triaxial accelerometer is shown in Table 1. The reliability of the SIM-G device was shown by calculating the Cronbach’s alpha for the SIM-G is shown in Table 2.
The Figure 2 shows the linear acceleration for both the tri-axial and SIM-G for the frontal impacts but there is the same trend shown for the impacts in the other locations, i.e. left side, right sides, and rear.

Comparison of Linear Acceleration from SIM-G and Tri-axial Accelerometer so to highlight the deviation of gold standard data with the Sim-G data.
Discussion
The main objective of this study was to investigate the validity and reliability of the SIM-G sensor by comparing it with the gold standard tri-axial accelerometer and 3 angular rate sensors. The internal consistency (repeatability) between each of the 10 trials at the 10 different heights is very strong (above α<0.9). However, the Pearson’s correlation coefficient (r), which measures the validity, had a substantially large range from 0.2 to 0.9, which corresponds with a weak to very strong dependence on the position and the linear acceleration, rotational velocity and or rotational acceleration [18].
It must be noted that as the impacts exceed approximately 80g, the linear acceleration does not seems to increase linearly like the results of the tri-axial accelerometer. The Figure 2 shows the linear acceleration for both the tri-axial and SIM-G for the frontal impacts but there is the same trend shown for the impacts in the other locations, i.e. left side, right sides, and rear. By splitting our results from 25 – 80 g and above 80 g the Pearson’s correlation coefficient, r=0.97, r=0.82, for the peak linear acceleration which partially agrees with Karton and associates [15]. They report that the SIM-G is highly correlated with r = 0.88 for peak rotational acceleration, r = 0.91 for peak linear acceleration and r = 0.98 for peak rotational velocity for the low, medium and high impact accelerations of 30, 50, and 80 g. The explanation of the division of low, medium and high is not provided in the paper but the logic for the high impact level of 80 g is based on the assumption that laboratory settings tend to overestimate the response [15]. Our data shows that a researcher or clinician one must be extra careful in interpreting the data as even though the impact recorded should be above 80 g the SIM-G maybe underestimating. This could be extra worrisome, as the higher impacts tend to be more indicative of a possibly severe head impact [19, 20].
To date, there are only 2 published studies that have investigated the validation of the SIM-G sensor, one by the manufacturer (Triax Technologies) [21] and one by an independent group [17]. As the results of both of these studies are reported differently, Pearson’s correlation coefficients (r2=0.98-0.99) and root mean square errors (13-75%) a comparison is difficult. Furthermore, as there is no data showing the acceleration magnitudes further investigation is warranted.
Our data shows that the validity of the SIM-G varies largely depending on the location of the impact for both linear and rotational components. As the SIM-G data is transformed to be an estimation of the head’s center of gravity this might be one of the sources of error [15]. An additional source of error is the sampling frequency of 1000 Hz and bandwidth below 200 Hz for typical gyroscopes [14]. Furthermore, they recommend that the bandwidths should be different for helmeted and non-helmeted sports [13]. Our testing would especially amplify these drawbacks as the hybrid 3 dummy head hits an aluminum anvil, which would represent a hard contact test condition. In addition, as this study has only 4 impact locations, it does not verify the impact location, which needs to be verified in future studies. Therefore, we would like to recommend that the sensor should be tested for face validity based on the sporting environment, especially the sporting surface, such as grass (including artificial turf), martial arts matting, or a hardwood floor, where the sensor would be used in sport. Furthermore, future studies should focus on both the surface of the impact and the filtering process of the data, therefore, to make all data more comparable.
Limitations
The limitations of the current study, such as the biofidelity of the Hybrid II head and neck, the lack of testing for oblique impacts to induce angular accelerations, and the linear nature of the set-up, should be considered when interpreting the results. Furthermore, the impact surface in our set up could be deemed to harder in comparison to both natural and artificial turf, that this used in soccer or American football playing fields [22]. However, as the wireless head-band sensor may be used in a varying number of helmeted and helmetless sports is it difficult to create an identically ecological situation in the laboratory due to the large range of playing surfaces that sports are competed on [23]. Similarly, various researchers test protective headgear and helmets at oblique angles to be able to represent what happens in the field more realistically [24-26].
Conclusions
In conclusion, this study illustrates that the Sim-G headband must be used with caution as the validity of the data is highly questionable. Clinicians and researchers must be weary using the system for logging of head impact data as a method to alert the medical staff of a dangerous impact as the magnitudes above 80g become highly unreliable. Further reliability and validity research into other available head impact monitors should be continued as the importance of monitoring head impacts for more comprehension is critical for the long-term safety for athletes.
Acknowledgements
This work was supported by a 2-Year Research Grant of Pusan National University.
Notes
The authors declare no conflict of interest. The founding sponsors had no role in the design of the study; in the collection, analyses, or interpretation of data; in the writing of the manuscript, and in the decision to publish the results.