Energy System Contribution during 1500M Running in Untrained and Endurance-Trained Asian Male College Students
Article information
Abstract
OBJECTIVES
To compare the aerobic and anaerobic energy system contribution during 1500m running between collegiate untrained (UT) and endurance trained (ET) subjects.
METHODS
Five Asian UT (age: 23.8 ± 0.4 yrs, body fat %: 15.9 ± 5.7 %, height: 174.0 ± 4.1 cm, weight: 65.5 ± 4.1 kg) and 5 Asian ET male participants (age: 24.4 ± 3.9 yrs, body fat %: 12.9 ± 6.9 %, height: 169.4 ± 5.1 cm, weight: 60.6 ± 8.1 kg) participated in this study. Participants attended 3 sessions to determine their body composition, submaximal and maximal oxygen consumption (VO2max) test, 1500m track running session (RS) and 1500m treadmill RS. The maximally accumulated oxygen deficit (MAOD) method was used to calculate energy system contribution.
RESULTS
The times for the 1500m track run for the UT and ET were 428.0 ± 48.7 and 331.6 ± 14.0 seconds (p=0.004) respectively. There were no significant differences in VO2 between the 1500m track and treadmill RS indicating the participants ran to their personal best times for both trials. The mean VO2max(mL•kg-1•min-1) were significantly different between UT (45.1 ± 5.0) and ET participants (58.3 ± 2.2) (p=0.002). The mean relative contributions of the aerobic and anaerobic energy system during 1500m running were significantly different for the UT, 65.4 ± 7.0%, 34.6 ± 7.0 and ET, 75.7 ± 1.5%, 24.3 ± 1.5 % (p =0.011).
CONCLUSIONS
The point of equal contribution of the aerobic and the anaerobic systems occurred after thirty to forty seconds of intensive exhaustive running after which the aerobic contribution continues to increase while the anaerobic contribution decreases with increasing duration. By the end of 60th second of exhaustive running, the ET mean aerobic contribution is 71.5% compared to the UT’s 58.6%. This finding suggests a greater reliance on the aerobic energy system by the ET.
Introduction
Pre-competition trainings or exercise routines often require proper planning, therefore evaluating energy supply is fundamental to aerobic and anaerobic workouts. Some sport practitioners may not recognize the relative contribution of aerobic energy even in short duration-high intensity type exercise bouts [1]. Additionally, Medbo et al. [2,3] found that intense exercise lasting a few minutes is heavily dependent on energy released from both aerobic and anaerobic processes. The knowledge of relative contributions of the aerobic and anaerobic energy systems are critical in evaluating energy requirements for discrete sporting events [1]. The point of equal contribution refers to the exact point in time during exercise where the aerobic and the anaerobic energy systems contribute equally to the energy demands of that particular exercise bout. The point of equal contribution occurs between 1-2 minutes of maximal exercise and possibly at the 75th second [2,6]. There has been significant disagreement in the literature as to the actual occurrence of this point of equal contribution [4,5].
Medbo [2], modified the oxygen deficit method to quantify anaerobic energy release during treadmill running and developed the maximally accumulated oxygen deficit (MAOD) method, which provided an accurate estimate of anaerobic energy release [2,3,7]. There have been a number of studies that have looked at the effects of training status and trainability of participants from MAOD [1,8,9]. Studies indicated no difference in anaerobic capacity (MAOD) between untrained (UT) and endurance-trained (ET) participants, while sprinters’ anaerobic capacity was 30% or significantly higher [7,9]. The relative contribution of the aerobic energy system was significantly higher in ET (54-63%) than in sprint-trained participants (43-47%) during the second half of a supramaximal running test over 400m [13]. Most research on training status of an individual and the trainability of individuals tend to focus on anaerobic energy release during short duration intensive exercise [7,9,10]; and there was greater biasness towards sprint-trained participants, who performed significantly better and achieved higher MAOD as opposed to UT and ET participants [11,12].
Most of the studies that utilize MAOD or other means of energy system procedures implement all-out exercise(s) to cause desired exhaustion over a given period of time [3,10,13]. Other studies conducted constant intensity exercise at a percentage of VO2max until exhaustion [7,9]. Some studies also investigated the training status and its effect on MAOD. However, these studies only compared MAOD across different groups based on training status [7,10]. However, conclusions from such studies may be limited to only elite level athletes. Hence, further expansion of the study may be conducted to investigate the energy contributions of UT individuals. The extended literature may not have a conclusive accurate profiling of the energy systems’ contributions of UT and subelite, ET participants in these long duration–high intensity type events. As such, focusing on the 1500m running event will eliminate any advantage that sprint-trained may have over other ET individuals.
The relative aerobic energy contribution to intensive exercise has been under-estimated over the years. Spencer & Gastin [1] indicated that it was considerable and greater than traditionally accepted in the literature for 200-1500m running, ranging from 29% for the 200m to 84% for the 1500m. Although Spencer & Gastin [1] focused on discrete sporting events, they used elite athletes for their study to enhance the accuracy of the data collected for each particular running event. There was no comparison group of UT individuals, thus the generalizability of the data was reduced. The purpose of this study was to determine the differences in energy systems contribution in collegiate Asian UT and Asian ET male participants during 1500m running. In addition, there are no studies to date conducted in Asian ET and Asian UT for relative contribution in energy systems.
Methods
Participants characteristics
Two independent groups were used for this study. The first group consisted of 5 collegiate Asian male UT participants, who have not engaged in any form of regular or formal fitness training for the past two years or engaged in recreational sports and other health related physical activities for not more than two times a week. The second group consisted of 5 collegiate Asian male ET participants, who had been participating in regular formal bouts of fitness training at least five to seven times a week for the past two years. The physical activity and sports history of the participants were determined through a questionnaire survey prior to the first testing session. The descriptive statistics of the two groups are presented in <Table 1>. The Physical Education and Sport Science, National Institute of Education ethical committee approved the investigation and conformed to the Code of Ethics of the World Medical Association (Declaration of Helsinki). All participants were given verbal and written explanations about the experimental procedures before signing a declaration of informed consent.

Descriptive characteristics of collegiate male untrained and endurance-trained participants
Experimental design
The experimental procedures were based on the experimental protocol used by Spencer [1] to quantify energy system contributions and were a variation of the original MAOD method of energy system quantification developed by Medbo [2]. All participants attended three testing sessions separated by four to seven days. Participants were told to abstain from strenuous exercise twenty-four hours preceding the tests as well as non-consumption of alcohol and caffeine. Additionally, participants also reported for testing in a three-hour fasted state and documented their dietary intake seventy-two hours preceding the first testing session. Hence, they followed a similar dietary intake in preparation for the next two testing sessions.
During the first testing session, participants underwent a Dual-Energy-X-Ray Absorptiometry (DEXA) scan (QDR-4500 elite, Waltham, MA, USA) to determine body composition. The submaximal and maximal treadmill protocols were explained to the participants to allow them to familiarize prior to actual testing. Thereafter, participants completed an easy short 3-5minute of jogging as warm up, followed by stretching. Participants donned on the portable Cosmed K4b2 (Cosmed, Italy) metabolic system that was used to measure their expired gases. The analyzer was calibrated before each test. Once participants were geared up and ready, they performed a series of five to seven discontinuous treadmill runs, each of duration of six minutes on a motorized treadmill (H/P/Cosmos Pulsar 3P4.0, Germany). Treadmill speed increased at each stage that ranged between 8 km·h-1 and 14 km·h-1, depending on the ability of the participant. Participants were allowed six minutes of recovery after each stage. Steady state oxygen consumption (VO2) for each stage was determined from VO2 readings captured during the last two minutes of each submaximal run. Upon completion of the submaximal treadmill tests, participants were allowed a twenty-minute passive rest, before commencing the VO2max test, which utilized an incremental running protocol. The VO2max test started on zero gradient where the initial treadmill velocity for each participant was pegged to his treadmill speed attained for the last submaximal run. Treadmill velocity increased 1km·hr-1 for each minute for four minutes and if the participant was still running, the treadmill gradient increased 1% each min until participant reached volitional exhaustion. All participants met at least 2 out of 3 requirements for VO2max achievement: 1) an increase of VO2 2.0 mL·kg-1·min-1 with further increase in work rate; 2) HR 195 beats·min-1; and 3) Respiratory Exchange Ratio (RER) 1.0 [13].
1500m track session
The second testing session was conducted at the same time of the day about 5-6 hours later after testing session one to minimize effects of diurnal variations. Prior to the test, participants were briefed on running a self-paced throughout the entire run. During this session, participants completed an all-out, individual, self-paced 1500m run on the track whilst wearing a portable gas analyzer, Cosmed K4b2. Data was continually downloaded from the participants as they ran the 1500m and each participant’s average velocity for the 1500m run for the treadmill was calculated.
1500m treadmill session
The third testing session was conducted at about the same time of the day between 48 and 72 hours from the previous two testing sessions. The participants ran 1500m on the treadmill. The treadmill gradient was set at 1% to mimic outdoor running [14] and the speed was set to each individual participant’s average running speed as determined after the 1500m run on the track. Participants stepped onto a moving treadmill, which was already set at their own individualized average velocity. Participants then ran until the time taken for them to complete the 1500m run on the track had elapsed. All data from the Cosmed K4b2 were averaged over 10-second time intervals.
Running efficiency relationships
Running economy regression lines were individualized. Medbo [2] utilized a range of submaximal intensities from 35-100% of VO2max. The lower intensity values were later discarded due to deviations from linearity, an irregularity that was also observed in this study. Therefore, to determine the individualized running efficiency relationships, intensities that ranged from 50-85% of VO2max were used. Visual screening was used to eliminate any outliers to achieve a R2 value close to 0.99 and deviations from linearity at the lowest and highest submaximal intensities [2]. This method enabled us to have a wide range of submaximal intensities such that progressive changes in efficiency were captured [11]. This ensured that during the 1500m-treadmill run, the underestimation of the energy demand was minimized.
Statistical Analysis
Individual linear relationships between steady state VO2 and treadmill velocity were extrapolated to estimate energy demand or O2 cost during the 1500m run, both on the track and the treadmill [13,14].
Oxygen Deficit Analysis
The oxygen deficit was calculated as the difference between estimated oxygen cost and the actual VO2.
Oxygen deficit = Estimated O2 cost – Actual VO2
The oxygen deficit was then utilized in the calculation for each individual to determine his energy system contribution.
Percent (%) Aerobic Contribution Calculation
% Aerobic contribution = (actual VO2/ estimated VO2) x 100
Percent (%) Anaerobic Contribution Calculation
% Anaerobic contribution = (O2 deficit/ estimated VO2) x 100
Comparisons between the Asian UT and Asian ET groups were evaluated using effect size as given by Cohen’s (d) effect size formula where values of 0.8 and greater are indicative of large and meaningful effect sizes which was similar to Spencer & Gastin’s [1] study. This statistical method allowed the comparison of treatment effects independent of sample size. Independent T-tests were used to determine the differences between the two groups. Multiple regression analyses were used to determine a set of independent physiological variables that could significantly account for the performance variance in 1500m treadmill running timings. A significant probability level of 0.05 was used.
Results
<Table 1> indicated the descriptive statistics data for the two groups. There was significant difference between both groups for VO2max (Asian UT: 45.1 ± 5.0 mL·kg-1·min-1 vs. Asian ET: 58.3 ± 2.2 mL·kg-1·min-1, p = 0.002). Effect sizes, as presented in <Table 2>, are given by Cohen’s(d) formula where values greater than 0.8 are considered large. It is important to note that for all variables that were significantly different, the values affixed to effect size as given by Cohen’s(d) formula range from 1.40-3.00. These are indicative of large and meaningful effect sizes. Results also indicated higher aerobic contributions for Asian ET as compared to Asian UT (Asian ET: 75.7% vs. Asian UT: 65.4%) <Figure 1>. <Figure 2 and 3> showed the energy system contributions for the UT and ET participants respectively for the first 60 seconds of the 1500m treadmill run. <Figure 4> indicated the oxygen deficit and VO2 for the initial three minutes of the 1500m treadmill run for both groups. The difference in the oxygen deficits and VO2 between the two groups widened from the onset of the 1500m treadmill run and increased as the duration of the run increased <Figure 4 and 5>. This highlighted the greater dependency of the Asian ET participants on the aerobic energy system as the primary source of energy.
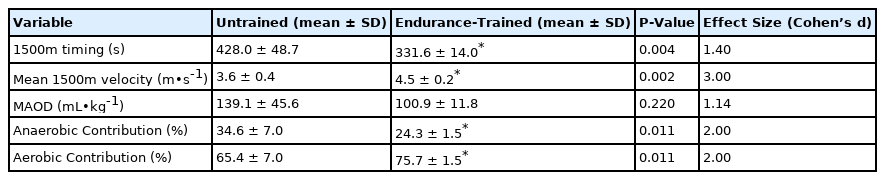
Performance characteristics of collegiate male untrained and endurance-trained participants
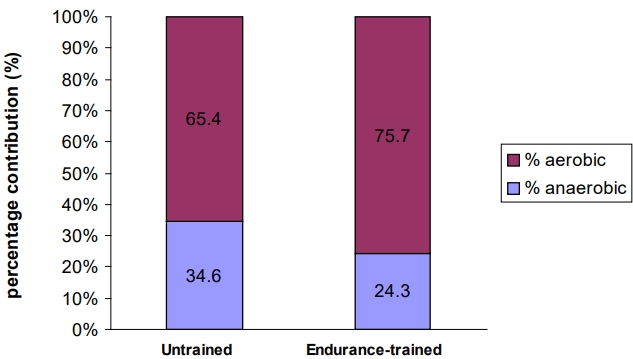
Total relative contributions of the aerobic and anaerobic energy system to a 1500m run between untrained and endurance-trained Asian participants. Data are in mean percentage values (%).
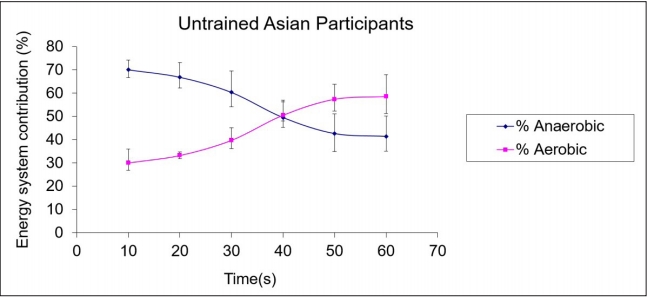
Energy system contributions in 10-second intervals for the 1500m run for untrained Asian participants.
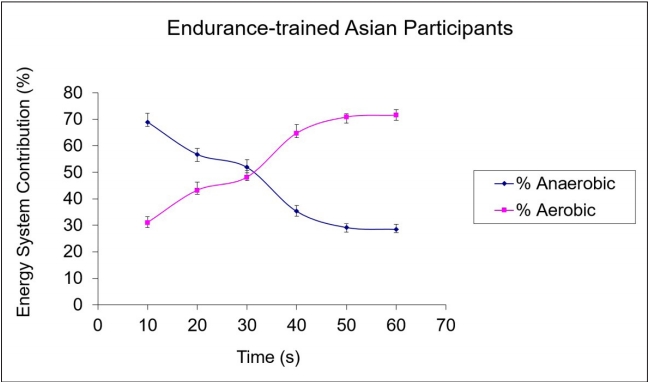
Energy system contributions in 10-second intervals for the 1500m run for endurance-trained Asian participants
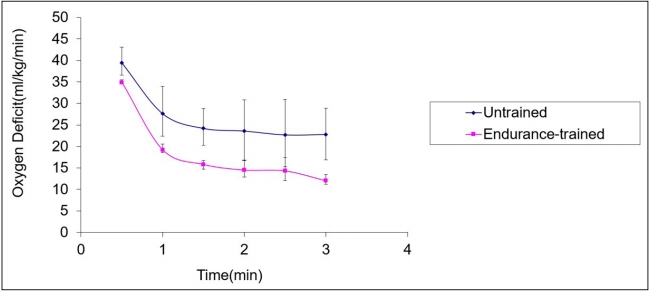
Oxygen Deficit for initial 3 minutes of 1500m-treadmill run for untrained and endurance-trained Asian participants.
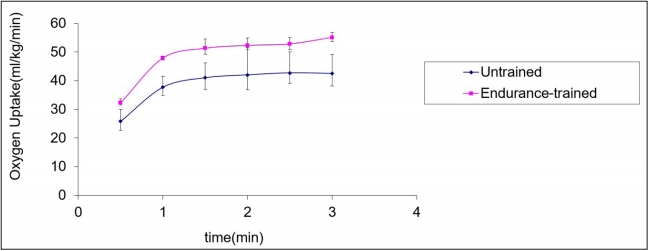
Oxygen Uptake for initial 3 minutes of 1500m-treadmill run for untrained and endurance-trained Asian participants.
Multiple regression analyses were used to determine the relative contribution of physiological variables in explaining the variance accounted for in prediction of 1500m treadmill timing. VO2max is a significant predictor of 1500m treadmill running timing (p < 0.05, R2 = .723). When BF% was included in the model as a predictor variable for a more accurate analysis, it accounted for additional variance that was identified in step one of the regression analysis (p < 0.05, R2 =.76).
Predicted 1500m timing = 699.986 – 6.433 VO2max – 0.851 BF%
VO2max had a significantly negative correlation (r = - .868, p = 0.001) with 1500m timings and BF% had significant positive correlation with the 1500m timings (r =.475, p = 0.017) <Figure 6>.
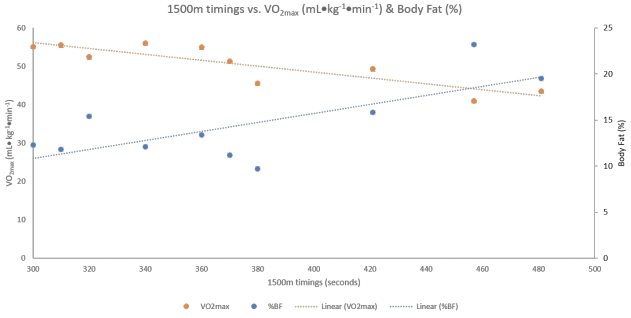
Significant negative and positive correlation between 1500m timings versus VO2max (mL•kg-1•min-1) (r = -.868, p = 0.001) & Body Fat (%) (r = .475, p = 0.017) respectively.
Discussion
The principal finding of this study indicated that the total relative contribution of the aerobic system to the Asian ET was significantly greater (75.7 ± 1.5 %) as compared to the Asian UT participants (65.4 ± 7.0 %) during a 1500m treadmill run (p = 0.011) <Figure 1 and Table 1>. The aerobic energy system predominated as the primary source of energy from as early as the 40th second of the 1500m treadmill run. The disparity in the aerobic energy system contributions between the two groups was congruent to the extended literature [1,11]. In this study, the mean aerobic contribution for the Asian UT and the Asian ET were lower than the 84 ± 3% reported by Spencer & Gastin [1] for elite 1500m specialist runners. Hence, we may conclude that Spencer & Gastin’s participants had a higher VO2 as compared to the Asian participants in this study that included collegiate Asian UT and Asian sub-elite ET individuals, which may explain the lower percent value. In contrast, the mean aerobic contribution for the collegiate Asian ET revealed similar results reported for sub-elite 1500m runners (75-83%) [15].
The MAOD method is a good indicative estimate of anaerobic capacity as it clearly distinguishes between aerobic and anaerobic energy production [7]. MAOD distinctly leveled off after approximately two minutes of constant supramaximal exercise [7,8,12]. It shows a clear indication that the total anaerobic energy release for any given bout of exercise, which is held to be constant, is maximal after two minutes. As the mean duration taken for both the Asian UT (428 ± 48.7 s) and Asian ET (332 ± 14.0 s) participants to complete the 1500m treadmill run was far greater than the two minutes recommended by Medbo [7] for MAOD to be maximal, it can be assumed that the MAOD achieved during the 1500m treadmill run were maximal.
The mean MAOD for the Asian UT and Asian ET participants were 139.1 ± 45.6 mL·kg-1 and 100.9 ± 11.8 mL·kg-1 respectively. The standard deviation of MAOD for the UT was considerably larger than the ET group. This was similar to the findings of Scott [7] who found substantially larger standard deviations of MAOD for the UT male participants when compared to the ET athletes. The large variance in MAOD standard deviations were possibly due to differences in treadmill running experiences amongst the UT participants [1]. The mean MAOD values for both the Asian UT and Asian ET participants respectively, were considerably higher than those reported by Spencer & Gastin [19] (47.1 ± 9.2 mL-1·kg-1) and Weyand [16] (46.8 mL-1·kg-1). Research had indicated that it was possible for non-competitive individuals to have a MAOD of 125mL·kg-1 [11,17]. The mean durations taken by the Asian UT (428.0 ± 48.7 s) and Asian ET (331.6 ± 14.0 s) participants to complete the 1500m run were considerably higher than those of either Spencer & Gastin [13] or Weyand [16] studies where participants were elite level runners, which may explain the relatively higher MAOD values. Furthermore, the participants in this investigation completed their runs in a mean time of approximately 380 seconds, participants in Spencer & Gastin [1] and Weyand [16] studies took approximately 226 seconds and 258 seconds respectively. Additionally, it had also been reported that the magnitude of MAOD attained during a particular bout of exhaustive exercise increases with duration [11]. Medbo [2] found that the magnitude of the MAOD attained increased three times as the duration of exhaustive bouts of exercise increased from fifteen seconds to two minutes, with negligible increases thereafter, up to 16 minutes, which also coincided with this study that revealed higher MAOD results.
The utilization of oxygen deficit as a measure of anaerobic energy release requires the duration of exhaustive exercise to be sufficiently long such that maximal glycolytic flux can occur and while being short enough, such that the resynthesis of phosphocreatine and lactate catabolism do not take place or kept at a minimal rate [2]. The relatively longer durations taken by the participants in this study may have resulted in the increased MAOD values because of phosphocreatine resynthesis, as full recovery of the ATP-PC system is completed in slightly over two minutes [6].
The statistical error in determining MAOD increases as event duration increases, such that the error increases from 4% for durations of two minutes to 10% for durations of seven minutes [2]. This could account for the higher MAOD values, as the mean duration taken by the participants in this study to complete the 1500m treadmill run was greater than six minutes. Therefore, it was recommended by Medbo (10) that exercise duration should not exceed three minutes in duration to minimize methodological errors in determining MAOD. As such, when using the oxygen deficit method of quantifying anaerobic energy release during a 1500m run, it was highly likely that the use of collegiate Asian UT and Asian ET subelite participants would result in an increased MAOD values. This justified the use of specifically trained, elite level athletes when quantifying energy system contributions in 1500m using MAOD methodology as mean durations rarely exceed four minutes [1].
Another plausible explanation for the high MAOD values in this study, for both groups, may be that at higher intensities, participants succumbed to greater vertical body movements recruiting more upper body muscles that would have otherwise not have been activated at the lower intensities of submaximal running. Medbo [2] found that participants who displayed the greatest vertical body movement gave rise to the largest deviations from linearity in the running efficiency relationships. This implied that increased vertical body movement resulted in greater errors in estimating MAOD from the individualized running efficiency relationships. Ramsbottom [18] attributed deviations from linearity in running efficiency relationships for athletes during high intensity track running to contributions from another musculature. These may provide additional evidence to support that increased MAOD corresponded hypothetically to a greater recruitment of upper body muscles as a result of greater vertical body movements.
The Asian ET performed significantly faster for both 1500m timing (p = 0.004) and mean velocity achieved during the run (p = 0.002). On average, the Asian ET completed the run 96 seconds faster than the Asian UT and at a faster velocity at 0.9m·s-1. Both groups’ lean mass (p = 0.151) and fat mass (p = 0.222) were not significantly different. As such, the disparity in performance in 1500m running could not be accounted by differences in body composition. This was congruent to the findings reported in the prevailing literature related to MAOD and training status [7,10,19].
The magnitude of the MAOD is also dependent on the anaerobic training status of the individual [12]. This study indicated no significant differences in MAOD between the Asian ET (100.9 ± 11.8 mL·kg-1) and Asian UT (139.1 ± 45.6 mL·kg-1) (p = 0.220), hence, the disparity in performance cannot be attributed to differences in anaerobic capacity. Anaerobic capacity may be limited in individuals; however, aerobic capacity can be increased through proper training. Therefore, regular endurance training had no effect on anaerobic capacity as both the Asian UT and ET participants shared similar MAOD [7].
Consequently, the superior performance of the Asian ET group can be explained by two main factors: i) significantly higher aerobic fitness ii) greater proportion of the total energy contribution via the aerobic energy system. The Asian UT (45.1 ± 15.0 mL·kg-1·min–1) and Asian ET (58.3 ± 2.2 mL·kg-1 ·min-1) participants had significantly different VO2max values (p = 0.002) <Table 1>. The effect size of the comparison also indicated a value of 2.40, which revealed a meaningful comparison for this study. This superiority in aerobic fitness of the Asian ET participants, as measured by VO2max may well translate into a greater reliance on the aerobic energy system as when compared to the Asian UT participants. Athletes with greater VO2max values subsequently contribute greater aerobic contribution to intense and exhaustive exercise [11]. The central and peripheral adaptations of the ET participants could have contributed to a significantly higher aerobic contribution (75.7%) in the 1500m run [6]. The better aerobic abilities of the ET participants as well as their superior ability to tap into the aerobic energy system then enabled them to achieve markedly higher work outputs, thus enabling them to outperform the UT individuals [7,19]. It was estimated that the lactic acid system, accounted for close to 70% of the MAOD [20]. Due to the insignificant differences in MAOD between both the Asian UT and Asian ET groups, it can be extrapolated that both groups relied on the lactic acid component of the MAOD to a similar extent. The clearance of lactate via the interstitial space into the blood capillary system is clearly improved by aerobic training [20,21]. This concomitant superiority of the cardiovascular system in clearing lactate more efficiently in ET participants then offers another explanation for the better performance of the ET group in the 1500m treadmill run.
In this study, the point of equal contribution of the aerobic and the anaerobic systems occurred after thirty to forty seconds of intensive exhaustive running. This is similar to Gastin’s [4] finding that a switch over to a predominantly aerobic contribution during exhaustive exercise can occur as early as the twentieth to thirtieth second, after which the aerobic contribution continues to increase while the anaerobic contribution decreases with increasing duration. This is congruent with our findings where the aerobic energy system for both groups is clearly the predominant source of energy after the point of equal contribution. More importantly, the difference in contribution between the two energy systems, after the point of equal contribution was markedly greater for the Asian ET than the Asian UT participants. This finding suggested a greater reliance on the aerobic energy system by the Asian ET participants. By the end of 60 seconds of exhaustive running, the Asian ET mean aerobic contribution was at 71.5% compared to the 58.6% of the Asian UT participants. The lower MAOD calculated for the Asian ET participants and their correspondingly higher VO2 also provided additional evidence that they exhibited a greater reliance on the aerobic energy system.
This early crossover to a predominantly aerobic metabolism by both groups is further proof that the aerobic energy system responds much more quickly to intensive exercise. This is supported by recent research that singled out the aerobic energy system as having a substantial contribution to the initial energy demand of exhaustive exercise [4,9]. The body stores of O2 constitute at least 10% of MAOD [2]. Thus, if MAOD for all participants had been corrected for body stores of O2, the transition to a predominantly aerobic metabolism may have occurred earlier, as early as the fifteenth second [1].
Interestingly, the point of equal contribution also marks the crossover point where the aerobic energy system starts to dominate as the predominant source of energy. This crossover seems to be greatly affected by training status or level of aerobic fitness. The results from the Asian UT participants in this study revealed that the crossover point occurred after forty seconds of exhaustive running, while for the Asian ET, it occurred just after thirty-two seconds into the 1500m run. The crossover to a predominantly aerobic contribution occurred fifteen seconds into the 1500m run for elite 1500m runners [1]. The results from this study also indicated that the higher the training status of the individual, the quicker the cross over to a predominantly aerobic contribution was achieved, which was found similar to Nummela’s study [9].
The mean VO2max values for the Asian UT and Asian ET as determined in this study and elite 1500m runners as reported by Spencer [1], were 45.1 ± 15.0 mL·kg-1·min–1, 58.3 ± 2.2 mL·kg-1·min-1, and 72 ± 4 mL·kg-1·min-1 respectively. It appeared that a higher aerobic fitness as measured by VO2max values, coincided with the attainment of a faster crossover to a predominantly aerobic metabolism. Therefore, it can be speculated that performance in a 1500m run increased with an earlier crossover to a predominantly aerobic energy contribution as indicated by the decreasing mean 1500m timings of 428.0 ± 48.7 seconds, 331.6 ± 14.0 seconds and 226.0 ± 0.05 seconds for the Asian UT, collegiate Asian subelite ET and elite level runners respectively.
The multiple regression analyses revealed that VO2max was the highest significant predictor (p = 0.001) of 1500m treadmill running timing. This is in accordance with findings by Weyand [16] who concluded that VO2max is the strongest predictor of 1500m running performance. The regression analysis revealed that VO2max accounted for 72.3% of the variance in 1500m treadmill running timing with prediction error of 2.5%. When BF% was included into the model, it accounted for 76% of the variance in 1500m treadmill running timing and both VO2max and BF% entered the model as a significant predictor variable with a prediction error of 1.0%.
Conclusion
The point of equal contribution of the aerobic and the anaerobic systems occurred after thirty to forty seconds of intensive exhaustive running after which the aerobic contribution continues to increase while the anaerobic contribution decreases with increasing duration. By the end of 60th second of exhaustive running, the ET mean aerobic contribution is already 71.5% compared to the 58.6% of the UT subjects. This finding suggests a greater reliance on the aerobic energy system by the ET. Similar to other research, results in this study suggest that an earlier crossover to a predominantly aerobic energy contributions results in better performance in 1500m running performance.
Acknowledgements
Authors would like to sincerely thank all participants who have volunteered for this study.
Notes
The authors declare no conflict of interest.