Effects of Unilateral Lower-extremity Joint Cooling on Movement Biomechanics during Two-legged Jumping and Landing
Article information
Abstract
OBJECTIVES
This study examined the immediate effect of unilateral ankle or knee joint cooling on the low-erextremity kinematics and kinetics during two-legged jumping and landing.
METHODS
Twenty healthy adults randomly completed three data collection sessions for ankle or knee joint cooling, or control. For each session, participants performed two-legged countermovement jumps and lands. For joint cooling, two ice bags were directly placed to the right side and secured with a compression bandage. A three-dimensional motion analysis system (200 Hz) with two floor-embedded force platforms (2000 Hz) was employed to capture the jumping and landing. The cooling effects on kinematical (flight time, and sagittal plane joint angles) and kinetical (peak vertical ground reaction force (vGRF), impulse, and sagittal plane joint moments) variables were examined. A mixed-model analysis of variance was performed for each dependent variable (p≤0.0001 for all tests).
RESULTS
We did not observe any interactions (flight time: F2,95=0.67, p=0.52; joint angles: F2,209≤2.26, p≥0.10; peak vGRF: F2,209≤1.76, p≥0.20; impulse: F2,209≤2.54, p≥0.10; joint moments: F2,209≤4.80, p≥0.01 for all interactions). Regardless of condition and time (side effect), subjects showed a dominant-leg predominant movement strategy. Specifically, the right side showed a greater peak vGRF (2%), and greater ankle (7%), knee (6%), and hip (11%) joint moments, as compared with the left side during jumping. The same movement pattern was observed during landing that there was greater peak vGRF (11%) and impulse (8%), and greater ankle and knee joint moments (15%). Regardless of time and side (condition effect), subjects with ankle joint cooling showed 5% lesser ankle joint moment during jumping, compared with those who received knee joint cooling (p=0.0001).
CONCLUSIONS
A 20-min of unilateral ankle or knee joint cooling seems to neither alter vertical jump height nor change movement biomechanics during two-legged jumping and landing.
Introduction
The vertical jump is one of the most important and frequent movements in athletic field [1, 2]; therefore, it is often performed for the purpose of training and evaluation. To maximise the capacity to vertically jump off, one must learn a quick pre-stretch of the lower-extremity with arm swinging followed by explosive contraction of the ankle, knee, and hip extensors at takeoff. The higher the jump, the greater the vertical ground reaction force (vGRF) that must be absorbed when landing [3], and improvements of the jump height must be accompanied by proper landing mechanics [4]. Along with increased vGRF [3], decreased knee flexion [5], and increased knee valgus [6] are considered risk factors for a traumatic musculoskeletal injury such as anterior cruciate ligament injury. Accumulated mechanical stress due to repetitive jumping and landing could lead to not only a gradual loss of stiffness and strength [7] but also overuse injury [8].
Cold application (also known as cryotherapy) is often used for enhancing athletic performance [9, 10]. For example, focal joint cooling (ankle or knee joint using ice bags secured with a compression bandage for 20 – 30-min) increased knee extension [11] or plantar flexion [12] torque. More functionally, knee joint cooling improved 20-m sprint speed that individuals who received 20-min of bilateral knee joint cooling ran 0.09-sec faster than those who did not receive joint cooling [13]. Along with the cases of performance enhancement, an acute use of cold application on the purpose of treating musculoskeletal injuries [14] is also common. For example, we occasionally see that football players receiving cryotherapy (i.e., knee joint cooling due to a blunt trauma) during the match. As the use of cooling modalities in the athletic field becomes more popular, any negative effect, such as reduction in particular performance (i.e., jump height or flight time) or increase in injury risk (i.e., stiff landing or knee valgus), needs to be examined.
Since the vertical jump is one of the key athletic activities, observing kinematical and kinetical alterations in responses to lower-extremity joint cooling would provide such information. Previously, a 20-min bilateral ankle or knee joint cooling reduced vertical jump heights [15]. Although performance reduction was explained by a total work reduction due to decreased joint moments and impulse at takeoff, movement alterations associated with jump height reduction following joint cooling are unknown. Reduced capacity to vertically jump off might be attributed to altered joint angles [16] or propulsion impulse [17]. In terms of injuries, it is important to explore the influence on landing kinematics or kinetics following a unilateral application of lower-extremity joint cooling. Since the lower-extremity joints are interrelated as the whole kinetic links [18], any movement alteration in both limbs should be compared with the movement alterations known to be associated with the risk of injury [19].
Therefore, the purpose of this study was to observe the effects of unilateral lower-extremity joint cooling on the lowerextremity kinematics and kinetics during two-legged jumping and landing. Specifically, we asked: 1) will 20-min of unilateral ankle or knee joint cooling applied to the dominant-leg change a flight time following two-legged maximal countermovement vertical jump? and 2) will the unilateral ankle or knee joint cooling alter jumping or landing kinematics and kinetics in the lower-extremity? As the temperature of the ankle or knee joint decreases due to joint cooling, subjects would experience several changes, such as afferent sensory information [13], nerve conduction velocity [20], enzyme process [21], and synovial fluid [22]. As a result, lower-extremity muscle contraction speed [23] during the jumping and landing tasks would be altered. We hypothesised that 1) flight time would be decreased; and 2) unilateral ankle or knee joint cooling would result in kinematic and kinetic changes in the lower-extremity.
Methods
Design
The independent variable that was examined was condition, time (pre- and post-condition), and side (non-dominant and dominant leg). The dependent variables were the lower-extremity kinematics (flight time, and sagittal plane joint angles) and kinetics (peak vGRF, impulse, and sagittal plane joint moments).
Participants
Twenty recreationally active adults (10 females and 10 males, 22.8 ± 3.0 years, 1.7 ± 0.9 m, 65.9 ± 12.2 kg) participated in this study. To be eligible for the study, participants had to be free of any history of lower-extremity or lower back injury for the past six months and no orthopaedic surgery in their lifetimes. Participants were excluded if they had any neuromuscular disorder, cardiopulmonary disease, or medical condition such as hypertension or diabetes. Prior to participation, all participants were informed of the testing procedures and provided written informed consent, approved by the university’s Institutional Review Board.
Sample size was estimated for the flight time, by using a previous study [15] which reported a statistical difference in two-legged vertical jump height (4.3 cm with a standard deviation of 6.2 cm) following joint cooling. To detect the similar difference in flight time, a vertical jump height of 4.3 cm was converted into a flight time (0.05 sec) using the previously established formula [1]. Our calculations estimated that 19 individuals would be necessary.
Testing Procedures
Upon arrival at the laboratory, participants changed into standardised spandex shorts and shirt, running shoes, and socks. After a self-paced warm-up consisting of stationary biking and stretching for 10-min, the instructions on the successful two-legged jumping and landing task were given, and participants performed several practice trials. Participants were asked to stand with each foot on separate force platforms. After initiating a self-determined countermovement with arm swinging, participants were instructed to vertically jump off as high as possible and land on the same force platforms. For a successful trial, the participant’s feet must be located on each force platform when jumping and landing task. If any foot was off the force platform during the task or could not return to the starting position after landing, the trial was repeated [24]. Once participants were able to consistently perform the jumping and landing task, the 16 reflective markers (12-mm) were attached over the anterior superior iliac spine, posterior superior iliac spine, mid-thigh, lateral epicondyle of the femur, mid-tibia, lateral malleolus, heel, and the 2nd metatarsal on both limbs, guided by the Plug-in-Gait marker set (Figures 1A & 1B). Anthropometric data for each participant were obtained. Participants then performed three successful trials of the two-legged jumping and landing task with a 60-sec rest interval between trials.

Market setup from the front (A) and rear (B) view. Definitions of the lower-extremity joint angles (C).
After the pre-condition measurements, participants experienced one of the three conditions (ankle or knee joint cooling, or control—no joint cooling) in a counterbalanced order each session. For a focal joint cooling, two ice bags (filled with 1 L crushed ice) were directly placed on the dominant-leg (the leg to kick a ball) and secured with a compression bandage. The ice bags were applied to the medial and lateral sides for the ankle joint cooling, while the ice bags were on the anterior and posterior sides for the knee joint cooling [25]. In the control condition, participants remained in a seated position for 20-min without cooling. Post-condition measurements were obtained in the same manner as the precondition.
Data Collection and Reduction
Three-dimensional marker trajectories synchronised with GRF data were sampled using eight near-infrared high-speed cameras (Vicon, Santa Rosa, USA) with sampling frequency of 200 Hz and two floor-embedded force platforms (AMTI, Watertown, USA) with sampling frequency of 2,000 Hz, respectively. Spatial trajectories from the reflective markers were digitised using the Plug-in Gait module in Vicon Nexus software programme (Vicon, Centennial, USA). These trajectory data were then filtered using a zero lag 4th-order Butterworth low-pass filter with cutoff frequency of 12 Hz, determined by a residual analysis [26]. The smoothed marker coordinates were used to define segment axes and joint centres through the Plug-in Gait model.
Flight time was calculated by counting the frames between takeoff (the last foot) and landing (the first foot) between the jump and land during the task [27]. The time points of takeoff and landing were defined as the last and the first frames where vGRF was greater than 10 N [28]. In this study, the data from peak knee flexion to the takeoff during jumping [29] and from the initial contact to the peak knee flexion during landing [30] were analysed. Lower-extremity joint angles were calculated using a Cardan sequence of flexion/extension, adduction/abduction, and internal/external rotation (Figure 1C). Peak vGRF was normalised to subject’s body weight (BW) [29], and net impulse was calculated by eliminating the impulse exerted by gravity in the sagittal plane [17]. Lower-extremity net internal joint moments were calculated by combining the anthropometric, kinematic, and force data using an inverse dynamics approach [31]. Joint kinematics and kinetics were exported to Matlab software (version 2020a, Mathworks, Natick, USA), and the necessary discrete values were identified. Specifically, kinematical variables including flight time, and sagittal plane joint angles (mean value), and kinetical variables including peak vGRF, impulse, and sagittal plane joint moments (mean value) were reported.
Statistical Analysis
Three trials of the two-legged vertical jumping and landing data at pre- and post-condition from each session were averaged and compared. The interaction of condition effect (ankle or knee joint cooling, or control—no joint cooling) over time (pre- and post-condition) on side (non-dominant and dominant-leg) were tested. Therefore, a two-way (flight time) or three-way (rest variables) mixed-model analysis of variance was conducted for each dependent measurement (fixed: condition, time, and side; random: subject). Tukey-Kramer pairwise comparisons were performed as a post-hoc test. The significant level was set at ≤0.0001 for all tests using a statistical package (SAS v9.4: SAS Institute Inc., Cary, USA). To examine practical significance, Cohen’s d effect size (ES) was calculated using the previously established formula (ES = [X1 – X2] / σpooled) [32].
Results
Kinematics
There was no cooling effect over time in flight time (condition × time: F2,95=0.67, p=0.52; condition effect: F2,95=1.65, p=0.20; time effect: F1,95=1.88, p=0.17), <Table 1>.
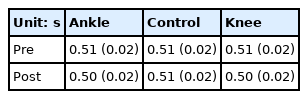
Changes in flight time during jumping and landing.
The values in mean joint angle (95% confidence intervals) are presented in <Table 2a>. There was no cooling effect over time on side (condition × time × side) in ankle joint angle (jumping: F2,209=0.01, p=0.99; landing: F2,209=0.09, p=0.91), knee joint angle (jumping: F2,209=0.02, p=0.98; landing: F2,209=0.03, p=0.97), and hip joint angle (jumping: F1,209=0.03, p=0.98; landing: F1,209=0.11, p=0.90). The statistical results (interactions and main effects) are presented in <Table 2b>.
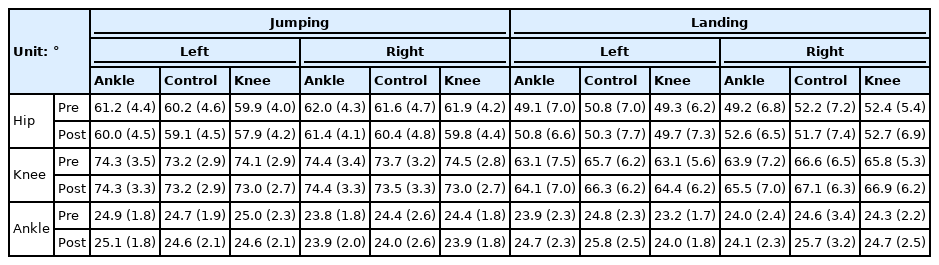
Changes in joint angle during jumping and landing.
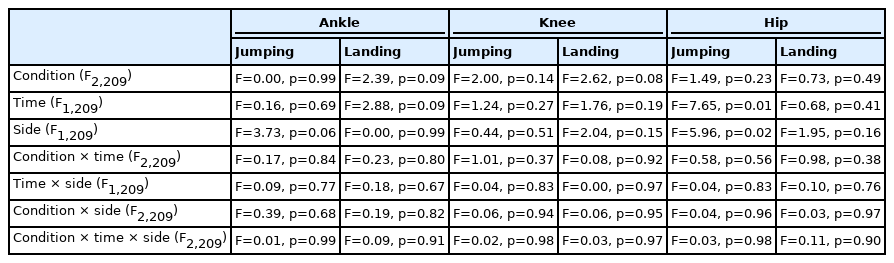
The results of three-way analysis of variance in joint angle.
Kinetics
The values in peak vGRF (95% confidence intervals) are presented in <Table 3a>. There was no cooling effect over time on side (condition × time × side) in peak vGRF (jumping: F2,209=0.19, p=0.82; landing (F2,209=1.18, p=0.31). Regardless of condition and time (side effect: F1,209=19.41, p<0.0001), the dominant-leg showed 2% greater peak vGRF (ES=1.63), <Figure 2A>, as compared with the non-dominant-leg during jumping. Regardless of condition and time (side effect: F1,209=23.02, p<0.0001), the dominant-leg showed 11% greater peak vGRF (ES=2.03), <Figure 2B>, as compared with the non-dominant-leg during landing. The statistical results (interactions and main effects) are presented in <Table 3b>.
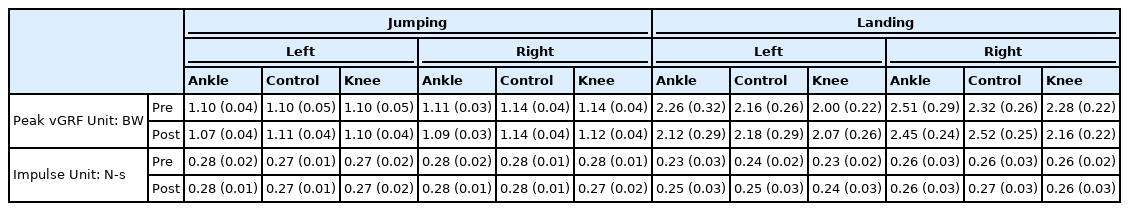
Changes in peak vGRF and impulse during jumping and landing.

Significant main effects. There was a side effect in peak vGRF during jumping (A) and landing (B), and impulse during landing (C). There was a condition effect in ankle joint moment during jumping (D). There was a side effect in ankle joint moment during jumping (E) and landing (F), knee joint moment during jumping (G) and landing (H), and hip joint moment during jumping (I). Values are mean and the upper limit of 95% confidence intervals. Between-side effect sizes are displayed on top of the bars, except for Figure D (1.74 is an effect size between the ankle and knee conditions). (A) Peak vGRF during jumping: F1,209=19.41, p<0.0001. (B) Peak vGRF during landing: F1,209=23.02, p<0.0001. (C) Impulse during landing: F1,209=16.71, p<0.0001. (D) Ankle joint moment during jumping: F2,209=9.60, p=0.0001; Difference between the ankle and knee conditions (p=0.0001). (E) Ankle joint moment during jumping: F1,209=50.58, p<0.0001. (F) Ankle joint moment during landing: F1,209=36.51, p<0.0001. (G) Knee joint moment during jumping: F1,209=15.34, p=0.0001. (H) Knee joint moment during landing: F1,209=47.13, p<0.0001. (I) Hip joint moment during jumping: F1,209=42.40, p<0.0001.
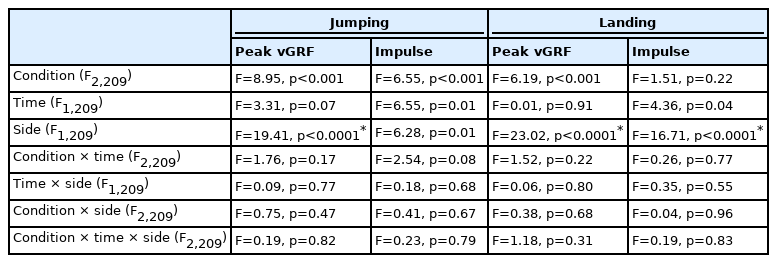
The results of three-way analysis of variance in peak vGRF and impulse.
The values in mean impulse (95% confidence intervals) are presented in <Table 3a>. There was no cooling effect over time on side (condition × time × side) in impulse (jumping: F2,209=0.23, p=0.79; landing: F1,209=0.19, p=0.83). Regardless of condition and time (side effect: F1,209=16.71, p<0.0001), the dominant-leg showed 8% greater impulse (ES=2.51), <Figure 2C>, as compared with the non-dominant-leg during landing. The statistical results (interactions and main effects) are presented in <Table 3b>.
The values in mean joint moment (95% confidence intervals) are presented in <Table 4a>. There was no cooling effect over time on side (condition × time × side) in ankle joint moment (jumping: F2,209=0.37, p=0.69; landing: F2,209=0.03, p=0.97), knee joint moment (jumping: F2,209=0.01, p=0.99; landing: F2,209=0.13, p=0.87), and hip joint moment (jumping: F2,209=0.84, p=0.43; landing: F2,209=0.05, p=0.95). Regardless of time and side (condition effect: F2,209=9.60, p=0.0001), participants with ankle joint cooling showed 5% lesser ankle joint moment (p=0.0001, ES=1.74), <Figure 2D>, as compared with those with knee joint cooling. Regardless of condition and time (side effect), the dominant-leg showed greater ankle joint moment (jumping: F1,209=50.58, p<0.0001, 7%, ES=2.17), <Figure 2E>; landing: F1,209=36.51, p<0.0001, 15%, ES=3.74), <Figure 2F>, knee joint moment (jumping: F1,209=15.34, p=0.0001, 6%, ES=3.41), <Figure 2G>; landing: F1,209=47.13, p<0.0001, 15%, ES=3.17), <Figure 2H>, and hip joint moment (jumping: F1,209=42.40, p<0.0001, 11%, ES=3.46), <Figure 2I>. The statistical results (interactions and main effects) are presented in <Table 4b>.
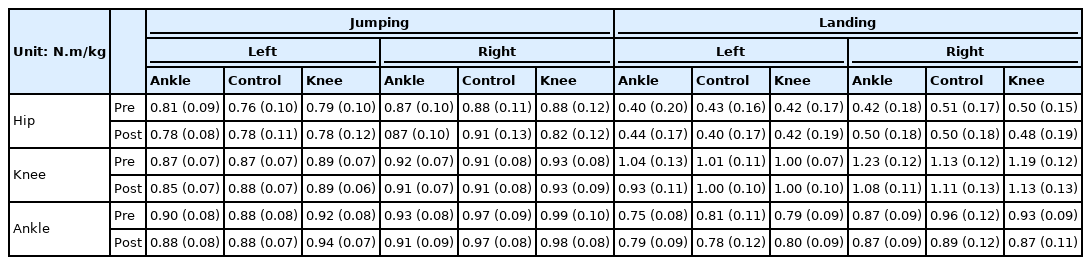
Changes in joint moment during jumping and landing.

The results of three-way analysis of variance in joint moment.
Discussion
We were interested in examining the influence of a 20-min unilateral ankle or knee joint cooling on flight time, and kinematics and kinetics during two-legged jumping and landing tasks in healthy young adults. The answers to the research questions are as follows: 1) the flight time did not change; and 2) our participants showed the dominant-leg predominant movement strategies during jumping and landing, and this movement pattern was generally maintained after the lower-extremity joint cooling. The main finding of our study is that the dominant-leg predominant strategy was not altered by 20-min of unilateral lower-extremity joint cooling (Figures 2A through 2C; 2E through 2I). Our data add to the existing literature about cold application in the sports medicine community in that the use of ice in the form of focal joint cooling neither hinders athletic performance nor increases the injury risk [13, 25, 33].
Flight time during a vertical jump is an important component since it can be converted into jump height [34]. As contrary to previous data on cold-water immersion [2, 35] or lower-extremity joint cooling [15], our participants’ jumping ability did not decline following the interventions, which should be interpreted as no change in jumping performance following unilateral ankle or knee joint cooling. While the previous study tested bilateral joint cooling [15], our joint cooling was only applied to the dominant-leg. Based on our data, we assume that the pattern of the lower-extremity muscle contractions during two-legged vertical jumping and landing are not altered by 20-min unilateral joint cooling. The population (basketball and volleyball players: athletic career: 9.6 years) in the previous study [15] could also explain why our participants (i.e., recreationally active) did not show performance reduction in vertical jump. For highly trained individuals, cryotherapy seems to have a bigger impact on jumping performance reduction [2]. Therefore, the degree of influence following joint cooling may be training status dependent. When combining the previous data [2, 15, 35] and our results, unless using CWI or bilateral joint cooling, unilaterally applied joint cooling does not seem to hinder athletic performance.
The dominant-leg leading movement strategies were observed in our participants (i.e., recreationally healthy young adults). Specifically, all the kinetic variables (peak vGRF, impulse, and ankle, knee, and hip joint moments) showed 2 – 11% greater values in the dominant-leg than the non-dominant leg during both jumping and landing (Figures 2A through 2C; 2E through 2I). Our results are consistent with the previous data on the side effect during double-leg movements which showed that there were greater vGRF [36], patellar tendon forces [7], and ankle and knee [7] joint moment in the dominant-leg than in the non-dominant leg. Regarding joint kinematics, our participants did not show any statistical difference since the largest difference between legs was 1.2 ° in hip joint angle (knee angle: 0.3 °, ankle angle: 0.7 °). While a couple of studies [37, 38] reported the side effect on lower-extremity joint kinematics during two-legged landing, the magnitudes of difference were small (knee: 1.7 °; hip: 1.2 °). Since the mean difference in joint angle that may increase the injury risk was 4.1 ° [39], observed mean differences in joint angle < 2 ° can be considered to be negligible. Since joint moments are the combined results of joint kinematics and kinetics, kinetical asymmetry (i.e., GRF and joint moments) between legs without any change in joint kinematics could be interpreted as different neuromuscular activation patterns between legs [40]. Since we did not observe any statistical interaction between side and condition, our results suggest that there was no cooling effect on the normal pattern of movement mechanics. Collectively, a 20-min unilateral joint cooling does not appear to increase potential injury risk factors in two-legged jumping and landing movements.
The only condition effect observed was in ankle joint moment. Participants with ankle joint cooling showed 5% lesser ankle joint moment during jumping, as compared with those with knee joint cooling (Figure 2D). The knee joint is the primary contributor relative to other joints during drop jumps [41]. While we did not know the relative contribution of each leg on these results, an increased ankle joint moment following knee joint cooling is a compensatory movement against a feeling of post-cooling joint stiffness [13, 15]. We think that a decreased ankle joint moment is also attributed to the similar cooling effect on the most distal extension joint. The extent of an averaged increase in knee joint moment (0.05 N∙m/kg) or an averaged reduction in ankle joint moment (0.01 N∙m/kg) relative to the control condition is small, suggesting that those kinetic changes minimally affect either the concentric (i.e., jumping) or eccentric contractions (i.e., landing).
Our study is not free of limitations. First, we manipulated condition, time, and side; thus, the study design is somewhat complicated. To answer the research questions, we performed a total of 17 separate three-way analysis of variances (each of them had three main effects and four interactions). To prevent the false positive conclusions (i.e., rejecting the null hypothesis), the threshold of the type I error rate was set as ≤0.0001. However, this could also produce a potential increase of the type II errors (i.e., false negative conclusions). When increasing the alpha level to 0.001, it can be statistically determined that there was a condition effect in the peak vGRF during jumping (F2,209=8.95, p<0.001 in Table 3b). Since the ES between the ankle and control conditions in this condition effect is calculated as 0.38, we believe that the threshold (p<0.0001) used in this study was not overfitted, at least. Due to the study design of three-way interactions, the sex-specific effect was not examined. Sex is one of the factors to influence the jumping and landing performances [44, 45]. Additionally, females have greater peak vGRF in reference to body weight [42], less capacity to absorb external force [43], and greater Q-angle [39] than males during two-legged landing. The results of this study were not reported with the frontal plane joint kinematics and kinetics, which could also be a study limitation. Therefore, it is necessary to test the effect of sex including the frontal plane biomechanics on the jumping and landing performances in the future research.
Conclusions
Twenty minutes of ankle or knee joint cooling (applied to the dominant-leg) did not affect lower-extremity kinematics (flight time, and sagittal plane joint angles) and kinetics (peak vGRF, impulse, and sagittal plane joint moments) on two-legged jumping and landing biomechanics. The main finding of our study is that recreationally active healthy young adults have the dominant side predominant movement patterns during two-legged landing following maximal countermovement jumping, and their movement strategies were not affected by unilateral lower-extremity joint cooling. Therefore, the use of focal joint cooling prior to or in the middle of the physical activity or sporting event (e.g., before the first half or during halftime) seems to be safe in terms of athletic performance and injury risk.
Notes
The authors declare no conflict of interest.