Associations of Physical Activity, Kidney Function, Diet, and Inflammatory Markers in High-Risk Type-2 Diabetes With Early-Stage Chronic Kidney Disease (CKD)
Article information
Abstract
OBJECTIVES
Quantitative information and associations of physical activity, kidney function, diet, and inflammation are dearth in high-risk diabetes. Yet could delay type-2 diabetes, late-stage chronic kidney disease (CKD) and could be useful in designing effective interventions. The study aims to quantify the associations of physical activity, kidney function, diet and inflammation in adults with high-risk type-2 diabetes (and early CKD) recruited to a lifestyle education programme.
METHODS
Baseline, 12-month dietary, accelerometery, and circulating inflammatory markers, Interleukin-6 (IL-6) and C-reactive protein (CRP) data were assessed from 159 (104 male) high-risk diabetes with stage 2 CKD (mean (SD) estimated glomerular filteration rate (eGFR); 77.5(7.6) ml/min/1.73m2, age; 66(6) years, BMI; 31.8(4.2) kg/m2) who were recruited to a lifestyle education programme. Linear regression examined the effects and associations of the outcome measures.
RESULTS
eGFR decreased by -2.0 (1.7) ml/min/1.73 m2 (P = 0.04) after 12-months, but mean daily steps, moderate to vigorous physical activity (MVPA) levels, intakes of fibre, total and unsaturated fat, and circulating IL-6 and CRP did not change. However, inter-individual responses were highly variable. eGFR correlated positively with baseline IL-6 (r = 0.17, P = 0.02). Unadjusted, there were no associations between change in eGFR (12_0) and change in any of the activity, inflammatory or dietary outcomes. However, the regression models of these outcomes for change in eGFR (12_0) became significant with multiple covariates.
CONCLUSION
A combination of healthy lifestyle behaviours should be encouraged for a positive effect on future kidney function.
Introduction
Diabetes is a major cause of chronic kidney disease (CKD) and the prevalence of CKD in people living with prediabetes is high [1]. The pervasiveness of CKD is established, and macrovascular diseases have been associated [2]. Also, high oxidative stress and systemic inflammation reported in CKD are the major contributors to the development of atherosclerosis and cardiovascular disease (CVD) [3].Thus, inflammatory biomarkers C-reactive protein (CRP) and interleukin-6 (IL-6) are proteins that facilitate acute and chronic inflammation associated with CVD morbidity and mortality in CKD [4,5]. The association between inflammatory markers and kidney function has been reported but with conflicting results [3,6] and to date, there are no longitudinal studies that examined these associations in high-risk diabetes with early-stage CKD. Quantifying these associations to design effective interventions could prevent diabetes and delay the progression of CKD in this population.
Patients living with CKD develop malnutrition and persistent low-grade inflammation which accounts for high mortality [7]. On the other hand, high fibre intake reduces inflammation and mortality in CVD [8], CKD [7,9], and in the general population [10]. Although dietary fibre is frequently low in CKD because of the low intake of fruits and vegetables rich in potassium [9],there is a close association between the gut and the kidney in CKD. The inflammatory status in CKD could be activated by the movement of a large amount of pro-inflammatory bacterial toxins (intestinal microbiota) from the gut to the blood (intestinal translocation), especially when the intestinal structural barrier is damaged from uraemia [11]. Therefore, the management of diet in CKD is vital to prevent disease progression and symptom management [12].
One of the cornerstone interventions in CKD prevention is to engage in regular physical activity (PA) as physical inactivity is a modifiable risk factor of the incidence and progression of CKD. The global recommendation and recent guidelines on PA are for adults to engage in at least 150 min of moderate intensity aerobic or 75 min of vigorous intensity aerobic PA weekly or a combination of both which is very comparable to that of these previous guidelines [13].Conversely, physical inactivity is linked to an increased risk of developing CKD and individuals with CKD are reported to be physically inactive [14].The activity level in CKD reflects a sedentary or low physical activity lifestyle which suggests the need for engaging in habitual PA [15]. Furthermore, regular participation of moderate forms of PA (walking) is safe, effective, and anti-inflammatory in non-dialysis CKD [16].The benefits of PA on kidney function and inflammation have also been greatly explored in CKD with emphasis on end-stage renal disease (ESRD) [17,18], and established non-dialysis CKD [16,19]. However, it is unclear whether the findings of these studies on kidney function and their inconsistencies on inflammatory markers will be modified by the progression or stage of CKD. Also, whether the identification of modifiable risk factors could reduce complications, facilitate the management, and improve the quality of life of this vulnerable group of individuals.
The present study examined the effect of a structured lifestyle education programme on the estimated kidney function, habitual PA (Moderate to Vigorous Physical Activity and daily steps), dietary intake of fats (total and unsaturated) and fibre, and inflammatory markers (IL-6 and CRP) in high-risk diabetes adults with early-stage 2 CKD. Furthermore, associations of these variables with changes in kidney function were quantified. We hypothesised that a lifestyle education programme would have a positive effect on the PA and diet and a negative effect on inflammatory markers, IL-6 and CRP. However, if there was a change in kidney function from baseline to 1 year, then it would have a positive effect on PA and diet but a negative effect on IL-6 and CRP.
Methods
Study Design
The present study is a prospective cohort analysis using baseline and 12 months follow-up data from the Walking Away from Type-2 Diabetes Study. The design and findings published elsewhere [20,21]. In summary, this was a clustered randomised controlled trial study that examined the effectiveness of a 3-year pragmatic structured education programme focused on increasing physical activity and promoting healthy lifestyles among adults at risk of developing Type-2 diabetes (T2DM).
Participants
Participants were recruited from 10 primary care practices in Leicestershire, UK, based on their high risk of developing T2DM [22].The detection of impaired glucose regulation was done using primary care electronic data, in a multiethnic UK community setting. Individuals with an increased risk of diabetes (any combination of impaired glucose tolerance (IGT) and/or impaired fasting glycaemia (IFG) or undiagnosed T2DM) were identified using a modified version of the Leicester Risk Score [22]. Individuals were unaware of their diabetes risk status before entering the study. Participants were randomised into 2 groups: control and intervention which was a 3-hourly group-based pragmatic structured education programme at the start of the study and once yearly. The control group were given a standardised detailed booklet on the risk and prevention of T2DM while the intervention group were given pedometers to self-monitor daily ambulatory activity in addition to 15 minutes short telephone calls every 6 months between annual assessments.
Dietary Data
Dietary information was obtained from the Dietary Instrument for Nutrition Education (DINE) food frequency questionnaire, designed for measuring fibre, total fat, and unsaturated fat intake in primary care centres [23].
Accelerometer Data
Participants wore a triaxial accelerometer (ActiGraph GT3X, Pensacola, FL, USA) on the right anterior axillary line above the hip during waking hours for 7 consecutive days at baseline and 12 months. Data were collected in 15-second epochs and re-integrated into 60-second epochs for this analysis. Freedson cut-points were used to categorise MVPA time (≥1952 counts min-1) [24]. Non-wear time was defined as a minimum of 60 minutes continuous zero counts and days with at least 600 minutes wear time were considered valid [25].Participants required a minimum of 4 valid days of measurement for their data to be included in the analysis [26]. For individuals to be classed as reaching recommendations they needed to have undertaken an average of at least 150 minutes of MVPA.
Kidney Function
The kidney function was estimated based on estimated glomerular filtration (eGFR) using the Modification of Diet in Renal Disease (MDRD) equation and participants were categorised by stages of CKD based on the National Kidney Foundation (NKF), Kidney Disease Outcome Quality Initiative (KDOQI).
Data Inclusion and Exclusion
From the initial 808 recruited, participants were grouped by CKD stage based on their baseline estimated glomerular filtration rate (eGFR). Using the MDRD equation, the highest proportion of participants were CKD2 (60-89 ml/min/1.73m2, n=464); then CKD1 (>90 ml/min/1.73m2 with or without comorbidities; n=289), CKD3A&B (30-59 ml/min/1.73m2, n=32), and unclassified (missing baseline eGFR; n=23) respectively [Figure 1]. The present study focused on CKD2. From the 464 individuals, 159 had valid measures of accelerometer and dietary data, IL-6 and CRP at both baseline and 12 months and were subsequently included in this analysis. Of the 305 who were excluded, 83 had missing values of eGFR at 12 months, 222 were excluded for failing to meet the minimum accelerometer wear time, and/or not providing dietary and biochemical data at both time points (baseline and 12 months).

Consolidated Standards of Reporting Trials (CONSORT) diagram
Statistical analysis
IBM SPSS Statistics v25 (Chicago, IL, USA) was used to conduct all statistical analyses. Data were presented as means and standard deviation (SD) unless otherwise stated. Mean comparison of control and intervention groups; included and excluded data were performed using t tests and χ2 tests as appropriate. Correlations of baseline and change in physical activity (MVPA and the average number of steps), diet (fibre, unsaturated and total fats), and inflammatory markers (IL-6 and CRP) with baseline eGFR and change in eGFR were assessed using Pearson’s (r). Linear regression models examined the independent associations between changes in MVPA, the average number of steps, dietary total and unsaturated fats, fibre, IL-6, and CRP with a change in eGFR at two-time points, as 12-months follow-up data minus baseline data (12_0) in the entire inclusion data [27]. Model 1 was adjusted for age, sex, ethnicity, anti-hypertensive medication usage (β-blockers), IMD score, and baseline eGFR. Model 2 was additionally adjusted for changes in accelerometer wear time and glycated haemoglobin (HBA1c), baseline MVPA, the average number of steps for the model with PA, baseline IL-6 and CRP for the model with inflammatory markers, and baseline values of fibre, unsaturated, and total fats for the model with diet respectively. To further establish and identify factors that could attenuate these relationships, Model 3 was further adjusted for changes in MVPA and the average number of steps for PA, changes in IL-6 and CRP, and changes in intake of fibre, unsaturated, and total fats. Results of linear regression analyses were presented as unstandardized beta-coefficient with 95% confidence intervals (CIs) at P<0.05 considered statistically significant.
Results
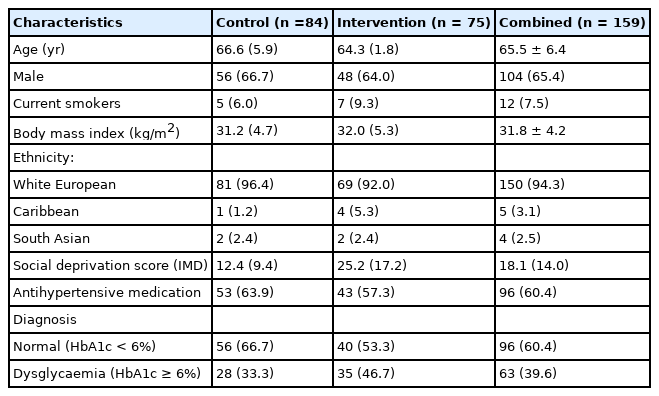
Comparison of demographic and baseline anthropometric variables of the groups (control and intervention) revealed no differences in age, sex, body mass index (BMI), and current smoking status [Table 1]. Likewise, measures of PA, diet, and inflammatory markers were similar in both groups at baseline and 12 months [Table 2]. Therefore, the whole cohort was considered as one group at baseline and 12 months [Table 3]. The majority were male (65%), White European (94%), with mean age (SD) and BMI of 65.5 ± 6.4 years and 31.8 ± 4.2 kg/m2 respectively. Approximately, 40% of the participants had dysglycaemia and 60% were on antihypertensive medications. In the combined group, eGFR reduced significantly from baseline at 12 months (P=0.04) with no difference in the other variables [Table 3].
Demographic, cardiometabolic, and anthropometric characteristics of participants
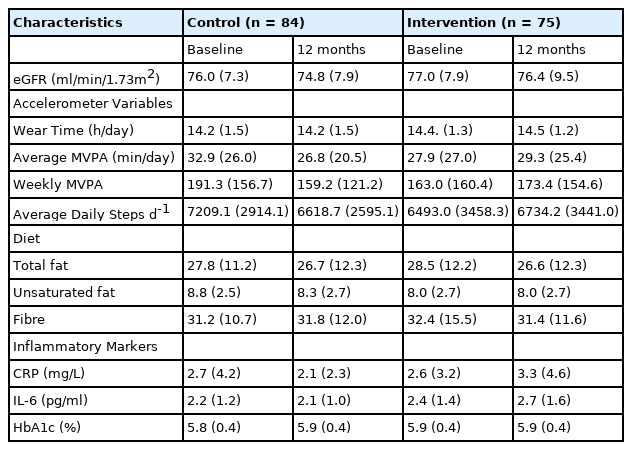
Kidney function, physical activity, diet, markers of inflammation, and HbA1c characteristics for the Control and Intervention groups; and at baseline and 12 months follow-up.
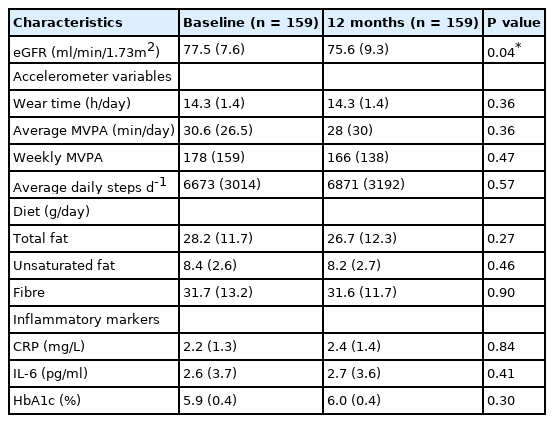
Kidney function, physical activity, diet, markers of inflammation, and HbA1c characteristics at baseline and 12 months follow-up.
Physical Activity and Kidney Function
All participants completed at least 4 days of valid accelerometer wear time at baseline and 12 months. Most participants completed 6 days of valid accelerometry at baseline (79.2%) and 12 months respectively (59.1%) with an average wear time of 14 (1.4) hours daily at both time points. From the 159 participants, 80 (50.3%) and 82 (51.6%) individuals reached the recommended guideline of ≥150 min/week of MVPA at baseline and 12 months. However, there were no correlations between baseline or 12_0 eGFR with baseline or 12_0 MVPA [Table 4]. Likewise, linear regression found no association with 12_0 eGFR and 12_0 MVPA [Table 5]. For 12_0 MVPA, the 1st, 2nd, and 3rd models explained 2.6% (R2 =0.026, F8,140=0.47, P=0.90), 45% (R2 = 0.454, F12,136=9.4, P<0.001), and 80% (R2 =0.806, F13, 135 = 43.2, P<0.001) of the variance in 12_0 eGFR.
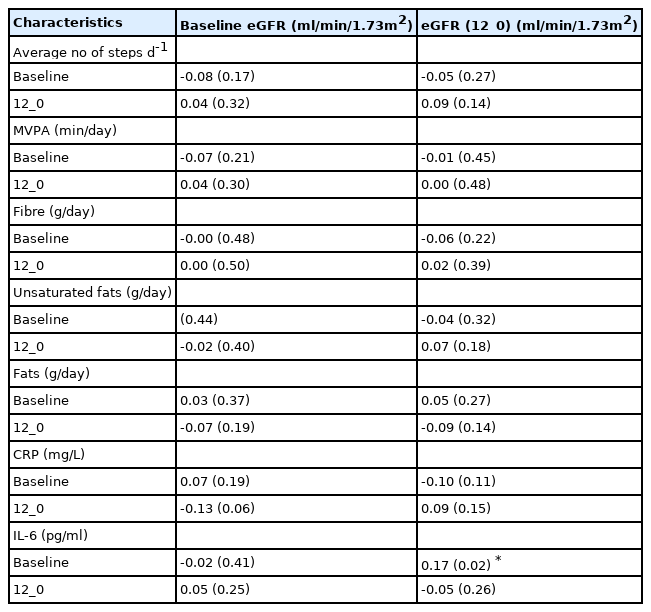
Pearson correlational analysis for baseline and changes (12_0) in physical activity, diet, and inflammation with baseline and change (12_0) in eGFR.
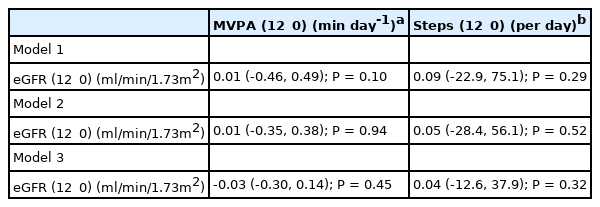
Multiple linear regression for MVPA and daily steps with eGFR.
Average daily steps
There were no correlations between baseline or 12_0 eGFR with baseline or 12_0 average daily steps [Table 4]. Regression analyses revealed no association between eGFR (12_0) and average daily steps (12_0) [Table 5] and models 1, 2 and 3 explained 5.3% (R2=0.053, F8,140=0.98, P=0.46), 35% (R2=0.346, F12,136=6.0, P<0.001) and 77% (R2=0.768, F13,135=34.4, P<0.001) of the variance in 12_0 eGFR.
Markers of Inflammation and Kidney Function
IL-6
There were no correlations between baseline eGFR with baseline or 12_0 IL-6, but 12_0 eGFR correlated positively with baseline IL-6 (r=0.17, P=0.02) [Table 4]. Linear regression revealed no independent association between change in IL-6 (12_0) and eGFR (12_0) for any of the models [Table 6]. Models 1, 2 and 3 explained 9.3% (R2=0.050, F8,140=0.93, P=0.80) 24% (R2=0.238, F12,136=3.5, P<0.001) and 46% (R2=0.460, F13,135=3.5, P<0.001) of the variance in 12_0 eGFR.
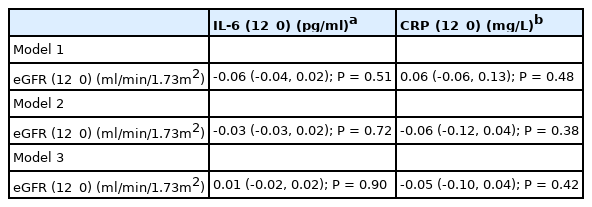
Multiple linear regression for changes in inflammatory markers IL-6 and CRP with eGFR.
CRP
There were no correlations between 12_0 eGFR with baseline or 12_0 CRP, but there was a trend for a negative association between baseline eGFR and 12_0 CRP (r=0.17, P=0.02) [Table 4]. Linear regression revealed no independent association between CRP (12_0) and eGFR (12_0) for any of the models [Table 6]. Models 1, 2 and 3 explained 3.1% (R2 = 0.031, F8,140=0.57, P=0.80) 41% (R2=0.414, F12,136=8.0, P<0.001) and 58% (R2=0.584, F13,135=14.6, P<0.001) in the variance in 12_0 eGFR.
Diet and Kidney Function
Unsaturated fat
There were no correlations between baseline or 12_0 eGFR with baseline or 12_0 dietary unsaturated fat intake [Table 4]. Multiple Linear regression also revealed no association between 12_0 unsaturated fat and 12_0 eGFR [Table 7]. Models 1, 2 and 3 explained 3.4% (R2 0.034, F8,140=0.61, P=0.77), 48% (R2=0.480, F13,135=9.6, P<0.001), and 50% (R2=0.502, F15,133=8.9, P<0.001) of the variance in 12_0 eGFR.
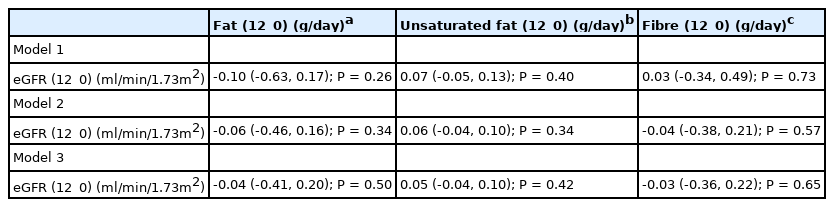
Multiple linear regression for changes in fat, unsaturated fat, and fibre with eGFR.
Total fat
There were no correlations between baseline or 12_0 eGFR with baseline or 12_0 total dietary fat intake [Table 4]. There were no independent associations between 12_0 total fat and 12_0 eGFR in the linear regression models [Table 7]. Models 1, 2 and 3 explain 3.6% (R2=0.036, F8,140=0.66, P=0.73), 47% (R2=0.467, F13, 135=9.1, P<0.001), and 50% (R2=0.502, F15,133=9.0, P<0.001) of the variance in 12_0 eGFR.
Fibre
There were no correlations between baseline or 12_0 eGFR with baseline or 12_0 total dietary fibre intake [Table 4]. There was also no independent association between 12_0 daily fibre intake and 12_0 eGFR [Table 7]. Models 1, 2 and 3 explain 3.0% (R2 = 0.030, F8, 140=0.54, P=0.82), 55% (R2=0.547, F13,135=12.5, P<0.001), and 56% (R2=0.564, F15, 133 =11.5, P<0.001) of the variance in eGFR.
Discussion
The present study examined the effect of a 3-year lifestyle education programme and associations of physical activity (PA), diet, and inflammation with kidney function over 12 months in high-risk diabetes adults with stage 2 CKD. As expected, kidney function declined after 12 months (as age increases) but this was not associated with independent changes in physical activity (MVPA, average daily steps), diet (fibre, unsaturated fat, total fat), or inflammatory markers (IL-6 and CRP). Linear regression models only become positively associated with the change in eGFR over 12 months when multiple covariates were included in the models, suggesting that, in this population, multiple lifestyle modifications could be implemented for a positive influence on kidney function. On the other hand, regular PA has been shown to delay CKD progression by reducing oxidative stress, inflammation, weight gain, and improving glycaemic control in diabetes with CKD [28].The present study and other studies [28,30] reported no association between kidney function and objective measures of PA, nevertheless, some other studies reported both positive [31-33] and negative [34] relationships. The contradicting results may be due to differences and wide variations in the stages of CKD (e.g. CKD1 – 4 [34] and CKD 3 – 5 [30]) and the differences in tools for assessing PA. Studies that observed a positive relationship examined PA using subjective measures (questionnaire/surveys), [31-32,35]while those that observed no relationship, or a negative relationship assessed PA objectively using accelerometers [28,30,34] as in the present study.
Globally, CKD is increasingly associated with obesity which is an inflammatory state that aids the disease progression [36]. A high fibre intake is associated with decreased inflammation and mortality in CKD [7,9,29]. Therefore, there are recognisable interrelationships with inflammatory markers, fibre, and kidney function but there was no demonstrable association with the change in eGFR over 12 months with dietary fibre intake and circulating levels of IL-6, and CRP, which contradicts previous studies. The previous findings could be related to the progression and stages of CKD (stages 3 - 5; advanced stages that may have progressed to ESRD with CVD). There is increased production of inflammatory mediators as CKD progresses [37,38] and IL-6 and CRP have been proven to be strong and independent predictors of cardiovascular mortality in CKD [39]. The present study examined stage 2 CKD with IL-6 and CRP levels suggestive of a relatively low basal level (and inflammatory state) with no significant increase from baseline to 12 months. This may have accounted for the conflicting results in previous studies that reported higher basal levels of IL-6 and CRP. Furthermore, a significant positive correlation was noted between eGFR (12_0) and baseline IL-6 that suggests a direct link with higher levels of inflammation and greater decline in eGFR.
The role of dietary fibre in the prevention of CVD and malignancy is gaining attention globally, prompting the recommendation to increase the daily intake of fibre [40].To date, there are no guidelines for dietary fibre intake for the CKD population but in the general population, 20-35 g.day-1 of soluble and insoluble fibre is recommended [41].The mean values of dietary fibre intake in the current study were within these ranges at both time points. Previous studies report an indirect relationship with dietary fibre and inflammation (as assessed by CRP or IL-6), but a direct association with dietary fibre and eGFR in stages 3-5 CKD [7,9]. These studies suggest a robust association of high dietary fibre with better kidney function and lower markers of systemic inflammation. The present study revealed no independent direct associations between kidney function, daily dietary fibre, fat and unsaturated fat intake and markers of systemic inflammation (IL-6 and CRP) in stage 2 CKD. Also, there were no associations between dietary fibre, IL-6, and CRP which could be as a result of the nature of the cohorts examined (early stage of CKD). However, linear regression modelling of the variance in the relationship between changes in dietary fibre and kidney function only explained a significant amount of the variance using model 2 (which included baseline dietary data and inflammatory markers) and model 3 (additionally including 12-month changes in dietary data and inflammatory markers), providing indications of the complex multifactorial nature of this relationship.
Due to the retrospective nature of this study, the ability to determine the causal inference is limited, and it is also likely that unmeasured confounding factors may influence the findings which is a major drawback of this type of analysis. Furthermore, analyses were limited to a 12-month observation period due to a lot of missing data in further years; a longer period with full data may have strengthened relationships and revealed stronger associations. Nevertheless, the key strength of the current study is that it provides insight into the influence of the change in known activity, dietary and inflammatory outcomes over 12 months on the decline in kidney function observed over the same time in an understudied population of patients with CKD. Understanding factors that can influence kidney function in the early stages of CKD is vital because the earlier the implementation of interventions, the higher the potential future benefit. While the study found no independent associations of objective measures of PA, dietary intake, and markers of systemic inflammation in a stage 2 CKD population at risk of developing diabetes, it does demonstrate that a combination of healthy lifestyle behaviours predicts kidney function, rather than individual aspects alone.
Conclusions
Changes in physical activity (MVPA, average daily steps), diet (fibre, unsaturated fat, total fat), or inflammatory markers (IL-6 and CRP) over 12 months are not independently associated with the expected decline in kidney function in a cohort of high-risk diabetes with stage 2 CKD. However, considering these factors in partnership provided a stronger model for the change in eGFR over 12 months. This suggests that a combination of healthy lifestyle behaviours is encouraged and implemented in early-stage and advanced-stage CKD to reduce the progression of CKD and have a positive effect on kidney function in the future.
Acknowledgements
This primary research was supported by the NIHR Leicester Biomedical Research Centre. Dr. Faatihah NiyiOdumosu was supported by the Commonwealth Scholarship Commission as this was part of her doctoral project. Professor Nicolette Bishop for her supervisory role during her doctoral project, Prof Thomas Yates and Dr Joseph Henson for providing the primary data of the Walking Away from Type-2 Diabetes Study, and the Mathematics Learning Support, Loughborough University for their support with the statistical analysis.
Notes
The author declares no conflicts of interest.